
The problem
What was actually wrong
Convergence is uneven. The first convolutional layers settle into edge and texture detectors in a fraction of the time the deeper layers need, but a standard training loop treats every layer as equally unfinished from the first step to the last.
Backward is the expensive half. A layer costs F going forward and up to 2F coming back: once for its weight gradient, once for the gradient it passes upstream. Freeze a layer at the head of the graph and both terms disappear, along with the input gradient for the layer just behind it.
And nothing is allowed to react. Batch size, learning rate and the set of trainable parameters are all chosen before step one and never revisited. A run that could safely speed up halfway through has no mechanism to notice, let alone act.
Approach
What I built
Observe. Forward and full backward hooks sample each watched layer every N steps: activation RMS, gradient RMS at the output and at the weights, and that layer's share of the network's total gradient energy. On the steps in between, both hooks return on their first line, so the steady state cost is a branch rather than a synchronisation.
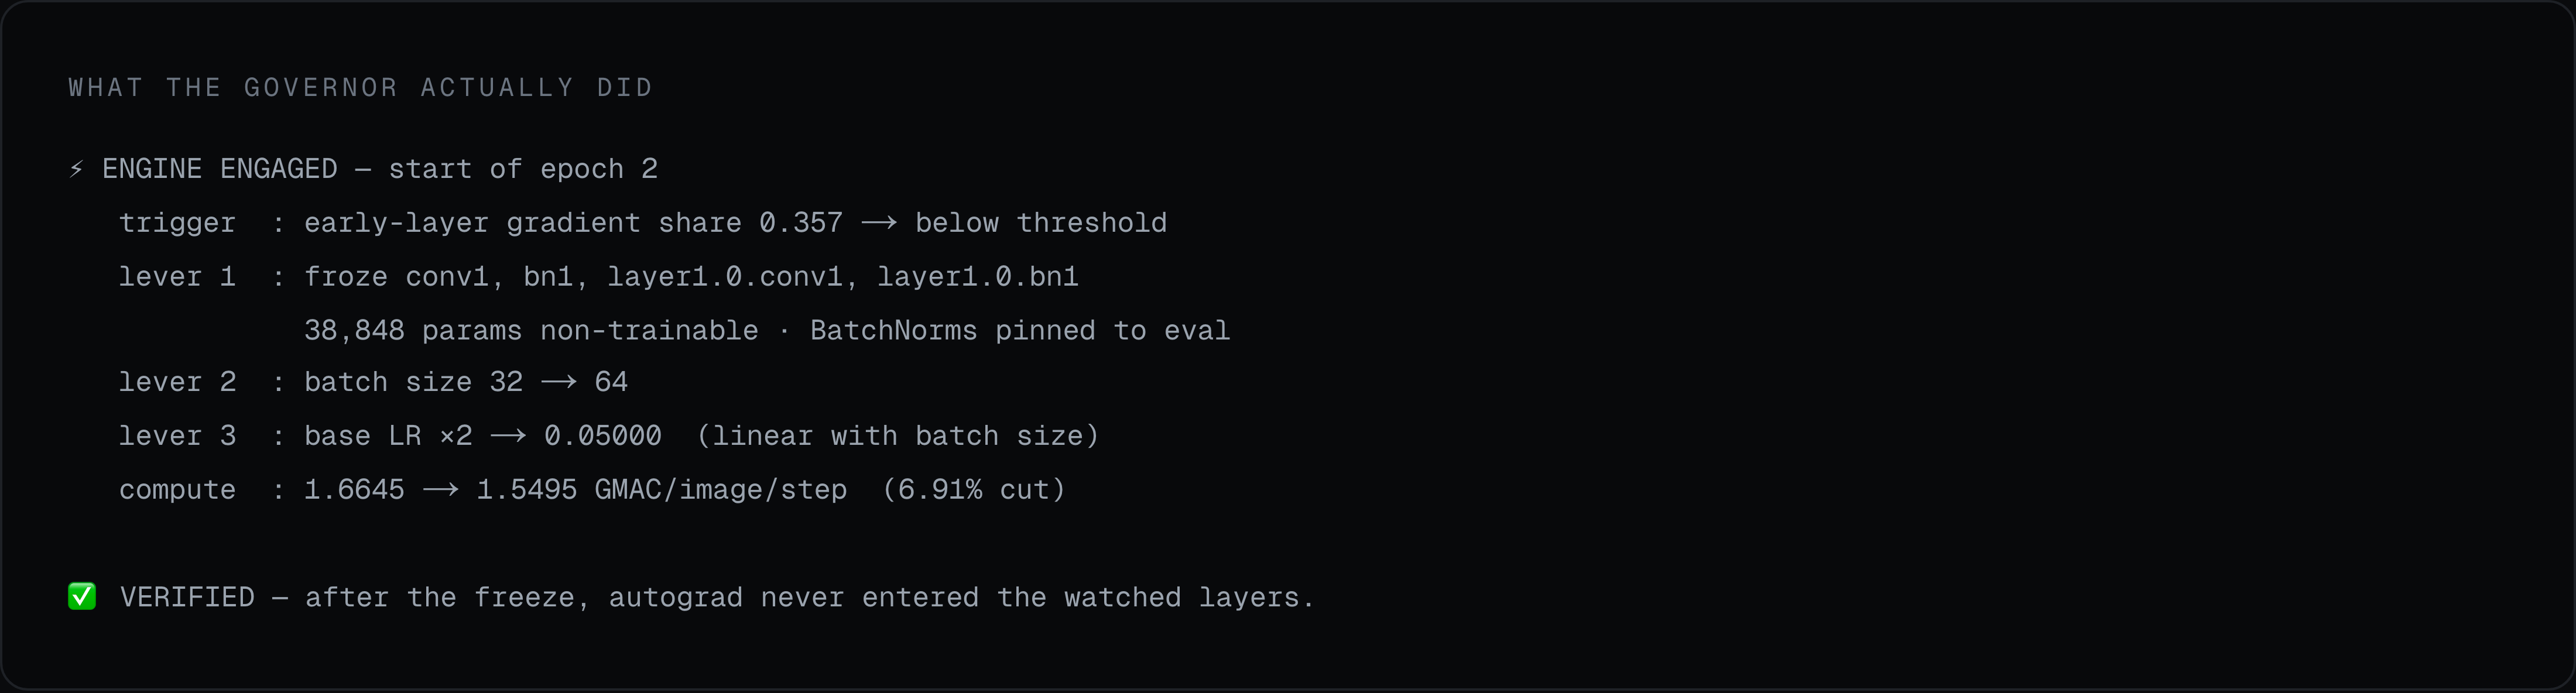
Decide. A governor reads that telemetry at each epoch boundary. When a layer's share of gradient energy collapses it has stopped contributing to learning and becomes a candidate. In the reference run the two watched layers fell from 35.7% of total gradient energy to effectively nothing.
Adapt. Freeze the layer and its BatchNorm, raise the batch size into the headroom the freeze just released, and rescale the learning rate linearly so the optimisation trajectory stays comparable. The run continues from exactly where it was, with no checkpoint and no restart.
Freezing four modules made 38,848 parameters non trainable, which is 0.35% of the model. It removed 6.91% of the compute. Early convolutional layers are tiny in parameters and expensive in operations because they run at full spatial resolution, so quoting parameter count here would understate the result by roughly twenty times.
Where it got hard
3 traps, all caught by instrumentation
Three things that looked like they worked
Each one produces a system that reports a saving while quietly doing something else. All three were found by measurement rather than by reasoning, and each now has a test that fails if it comes back.
- 01
Freezing BatchNorm does not freeze BatchNorm
Setting requires_grad to False stops the weight and bias updates. It does nothing about the running mean and variance, which are updated as a side effect of the forward pass, and model.train() silently puts the module back into training mode at the start of every epoch. Frozen BatchNorms are now held in eval mode and re-asserted after every model.train() call, with a test that fails if that re-assertion is ever deleted.
- 02
Stale gradients keep the optimizer moving
SGD skips a parameter only when its gradient is None. A gradient tensor left over from the previous step keeps updating a parameter that has supposedly been frozen, silently, with no error anywhere. Freezing now clears the gradient to None explicitly, and the test compares real weight tensors before and after optimizer steps instead of trusting the flag.
- 03
Changing batch size can cost more than it saves
Rebuilding the DataLoader to change batch size tears down and respawns the worker pool. On macOS those workers are spawned rather than forked, so each one re-imports the framework: about 20 seconds of dead time on a run whose baseline was 32 seconds. Batch size is now changed by mutating a sampler in place, so the loader and its workers are never touched and the transition costs milliseconds.
Not established
What these numbers do not show
This section exists because an efficiency claim is only worth what its methodology survives. The ablation arms were designed so they could have shown the freeze contributing nothing.
- Energy reduction is not established. The meter was CodeCarbon, which on Apple Silicon without root falls back to a constant TDP estimate. It attributed zero watts to the GPU doing nearly all the work, so the resulting energy delta is the time delta in different units.
- Accuracy parity is not established either. Across three seeds, final accuracy sits 0.33pp below baseline (t = -2.0, df = 2; significance at 5% would need |t| above 4.30). Not resolvable at this sample size, though all three seeds moved the same direction, which reads as a small real cost rather than parity.
- Wall clock does not transfer. On this hardware the same baseline configuration varies by 20% between seeds from thermal throttling alone, so every timing figure is normalised against a within run control rather than compared as raw seconds.
- One model, one dataset, one accelerator, three epochs. Twelve runs make the comparison internally sound. They say nothing yet about larger scale, other architectures, or multi device training.